まず,単一ニューロンの形態や機能の分析法から紹介する.昆虫脳 (図1A)では,ニューロンの細胞体はクラスターを形成し,脳表面に分布する.したがって,脳を頭部より完全に摘出し,生理食塩水で満たしたスライドグラスに固定した試料を,微分干渉装置と長作動距離対物レンズ(LUMPlanFl/IR, 倍率40倍,開口数0.80, 作動距離3.4 mm および 倍率60倍,開口数0.90, 作動距離2.0 mm)を備えた正立顕微鏡(BX51WI,Olympus)に設置し,近赤外光(波長>775 nm)を透過照明すると,個々のニューロンの細胞体を視覚化することができる
(図1B,C)
.したがって,近赤外光専用のCCDカメラ(C2741-79,浜松ホトニクス)で計測対象の細胞体群をとらえ,映像をモニタしながら,3Dマイクロマニピュレーター(ONU-31P,Olympus)を操作してガラス微小電極(10~100MΩ)を目的の細胞体に刺入することができる
(図1B,C)
.
電極内にはあらかじめ蛍光色素を入れておき,通電により細胞内に注入して,ニューロンを染色する.蛍光色素としては Lucifer Yellow CH,Alexa Flour 568あるいは,Neurobiotin(この場合,Cy-3 conjugated avidinで抗体標識する)を使用する.1つの脳標本に対して複数の異なるニューロンを同時に染色することも,また神経伝達物質の免疫組織学的染色と併用(二重染色)することにより,伝達物質の候補の特定もでき(図1D,E),神経回路を追跡するには都合がよい.
また,電極が細胞内に刺入されたかどうかは,膜電位から判断できるとともに,実際に蛍光色素を注入する様子を,蛍光照明装置で励起することにより確認できる
(図1B, C)
.このような手法により,昆虫脳で情報処理に関与する多数のニューロンの構造と機能のデータベース化を行い,その情報を活用することにより,カイコガのフェロモンにより解発されるプログラム行動のしくみを脳内情報経路,さらには神経回路の情報処理として分析し,理解できるようになった.
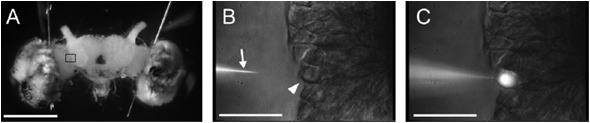
図1.カイコガの脳と脳を構成する単一神経細胞
(A) カイコガの脳の正面像.(B, C) 微分干渉装置を備えた正立顕微鏡により,(A)の脳を近赤外光(波長>775 nm)により透過照明すると,個々のニューロンの細胞体を視覚化することができる.3Dマイクロマニピュレーターを操作してガラス微小電極を目的の神経細胞の細胞体(矢頭)に刺入し,電極内の蛍光色素を注入して染色する.
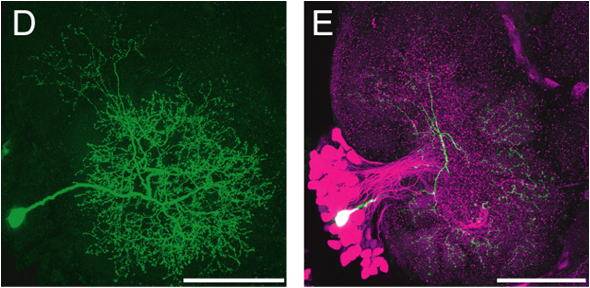
(D) 染色した単一の神経細胞.(E) (D)の脳標本に対して神経伝達物質の免疫組織学的染色を併用(二重染色)することにより,伝達物質の候補を特定する.ここでは,抑制性の神経伝達物質であるGABA免疫組織染色を同時に行うことによって,(D)の神経細胞がGABA抑制性神経であることがわかる.GABA抑制性神経は赤色に蛍光標識される.スケール:1mm(A),100um(B-E).
■Intracellular recording and staining (a single neuron) techniques
Intracellular recording and staining techniques for single neurons
Intracellular recording with a sharp electrode is used to detect the action potentials and small graded potential changes in the local membrane caused by synaptic events in a single neuron. In general, a signal is detected by a microelectrode (sharp electrode), which is connected to an amplifier, an oscilloscope, and a computer. The oscilloscope presents a visual display of the membrane potential over time. The signal is also sent to a computer that records data and graphically represents the results of an experiment online. A set up of intracellular recording includes equipment to hold the microelectrode and correctly position it to record from a neuron of interest. A microscope is used to ensure proper placement of the electrode for in vitro and in vivo recording of insect neurons. A micromanipulator is a device that allows fine movements, preferrably in the X, Y, and Z axes, permitting precise positioning of the microelectrode in the tissue. In this subsection, we briefly describe the application of intracellular recordings to an insect, especially silkmoth.
In an insect brain, cell bodies of neurons are located on the brain surface, forming clusters. Isolated brains can be used for the intracellular recordings. The isolated brain is immersed in saline dropped onto a slide glass where it is immobilized. The slide glass is mounted on the microscope. We usually use a differential interference contrast (DIC) microscope with long working distance objective lens. Using the DIC microscope, each of the cell cluster can be easily visualized (Fig. 1B, C). The image of visualized cell cluster is fed into a video monitor through a coupled charged device (CCD) camera (C2741-79, Hamamatsu Photonics, Japan) so that we can penetrate a glass microelectrode into a cell body using a micromanipulator (MHW-3, Narishige ) while monitoring the cell image on the monitor (Fig. 1B, C). The glass electrode used has 10~100 MW resistance.
A neuron can be stained by iontophoresis of a fluorescent dye through a glass microelectrode. For example, Lucifer Yellow CH or Alexa Fluor 568 (neurobiotin is not fluorescent and describing the detection reaction only complicates things) may be used. A number of neurons in a brain can be simultaneously stained using the same dyes. Besides, using immunohistochemical staining for a specific neurotransmitter in the same sample, a candidate neurotransmitter of the neuron can be identified. Using a dye-loaded glass microelectrode, the penetration of the electrode into a neuron can be judged by measuring the membrane potential of the neuron and detecting the injected dye excited by epifluorescencence illumination (Fig. 1B.C). These methods are suitable for identifying neuronal networks.
Using these methods, we can accumulate data from a large number of neurons in the silkmoth brain and develop a database. Information in the database allows us to analyze and understand the neural basis of the pheromone source orientation behavior of the silkmoth.
Fig. 1 The silkmoth brain and its neuron
A)Frontal view of the isolated silkmoth brain. (B, C) Method for visualizing a neuron. Each cell body can be visualized by illumination with near-infrared light using an IR-DIC microscope. The arrow indicates a glass microelectrode filled with Lucifer Yellow. The arrowhead indicates a cell body (B ). Penetrating a cell body with the glass microelectrode , injecting fluorescent dye through the electrode, and illumination with blue light allow for visualizing a neuron(C).
(D) A single neuron stained with Lucifer Yellow. (E) The sample shown in (D) was afterwards stained immunohistochemically. In this sample, an anti-GABA antibody was used that was additionally detected by a red-fluorescent antibody. Candidate GABAergic neurons are displayed in magenta. Scale: 1 mm in (A), 100mm in (B-E).